Coronavirus Italy - why we should be concerned when we predicted accurately
We published our predictions on the Coronavirus confirmed cases for 15th March in our previous post Coronavirus Italy statistics and predictions. Our predictions were 24734~25422, the actual number was 24747, the errors of prediction were -0.05% ~ 2.7%.
However it was not something worth of celebrating at this moment in this particular case. On one hand, the accurate preditions indicate that the development of Coronavirus in Italy had a pattern and we were good at finding this pattern. On the other hand, it also meant that, up to yesterday the 15th March, the Coronavirus situation in Italy were still following its historical pattern, which could lead to a bad closure of this pandemic outbreak.
If, in the next days, we don’t see abrupt down slopes in the day-to-day incremental curve, we might be looking at a “Gradually Contained Scenario” with a total confirmed infected population of 80,000+, overtaking China and becoming “number 1” before the end of March.
It’s not what we would wish. In this specific case, we’d rather be wrong at predictions and we look forward to seeing concrete, even better drastic, signals of improvement from numbers.

Coronavirus Italy - you need to be a good analyst first to be a good data scientist
Data science tools/algorithms can help you to think. But DO NOT let algorithms think for you!3 Use your own Human Intelligence first, then the Artificial Intelligence.
Leveraging the recent advances of machine-learning and AI algorithms can certainly help us to tackle complicated data, accelerate the analysis and optimize the results. However, for an eligible data scientist, nothing should replace the first step and the foundation of analysis - understanding the data.
We’ve seen some articles on how to use machine learning algorithms to apply Chinese experience to predict the diffusion of Coronavirus in Italy. The effectiveness of algorithms aside, the first batch of questions one should ask oneself are:
- Are these data trustable with decent quality? If not, can I and how can I fixed them?
- Are these datasets comparable? Am I trying to apply the models coming from the apples to the pears?
Data science is not only about throwing the data into the algorithms, tuning the parameters and waiting for the machines to tell you the results. Mastering well data science tools can make you a qualified Data Engineer but not necessary a good Data Scientist.
With regard to the Chinese data, we retain our doubts on numbers from the earlier days. We wonder that, in the earlier days, a part of infected cases with few symptoms or mild symptoms were not included in the statistics due to the scarcity of test kits, similarly, with the death cases. Both these numbers could be underestimated.
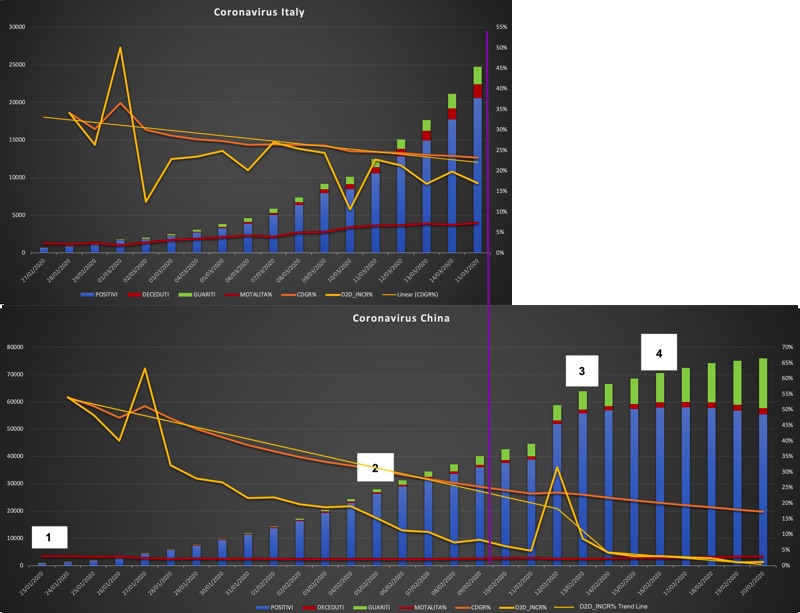
As labeled in the chart above, there were several events that drove the direction of Coronavirus spread in China. In order to understand whether the Chinese pattern can be applied to Coronavirus Italy, we should understand first what were these events:
- 23/01/2020, decision of lockdown of Wuhan city. However, 5-million people have left Wuhan and 9-million remained. That was the main reason that, even after the lockdown, the spread continued in the nearby cities of Hubei provinces and then across the country.
- 05/02/2020, decision to build temparary shelter hospitals in Wuhan to treat novel infected patients even with mild symptoms or during the recovery stage but still contagious to others. The admission was compulsary and no residential quarantine is allowed for test-positive patients. Since February 5, 14 shelter hospitals in the city have been operating and have treated more than 12,000 cases.
- 13/02/2020, officially announced the new governors for both Wuhan city and Hubei province. Rigorous and thorough scrutinies have been conducted to screen out and admit test-positive patients in order to cut off further spread. (We’ll spare you on the “advanced” tracking technologies have been used;)
- 16/02/2020, target date promised from the new governors to have all positive patients hospitalized. Hence the sharp dip of the trend line of new cases.
We suspected that similar measures could have been taken in Italy. Therefore we’re not sure it’s logical to simply apply the Coronavirus China pattern to Coronavirus Italy.
TECHENGINES.AI constantly looks for like-minded collaborators who are passionate in Data Science. Check out TECHENGINES AI FORCE - Free Course Data Science 101.
The free course that will be shared on the TECHENGINES GitHub Account with limited private access from 6th April 2020. If you’re interested in starting your Data Science jouney from scratch, please send your CV to info@techengines.ai to secure your reserved seat.